Compound growth is one of the most frequently cited concepts in investing education, and also one of the most consistently underestimated in practice, even by people who can define it correctly. The gap isn’t usually a knowledge problem — most people can explain that returns earn returns on themselves over time. The gap is intuitive: human intuition is built for linear patterns, and compounding isn’t linear.
Why linear intuition gets compounding wrong
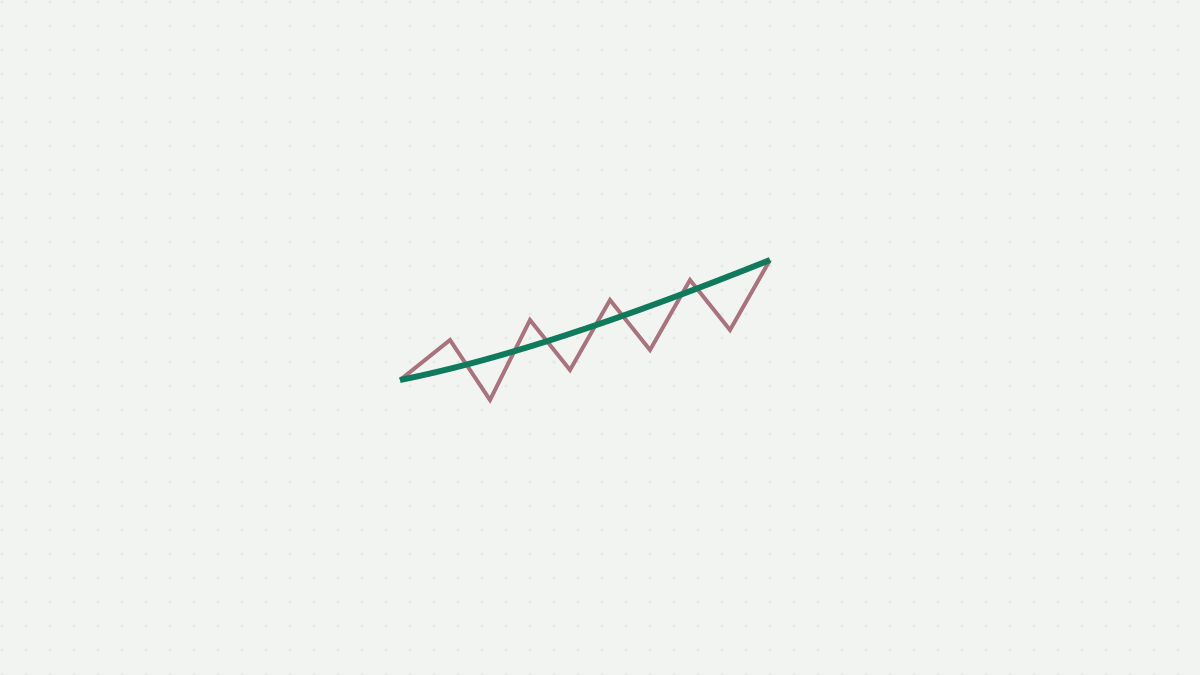
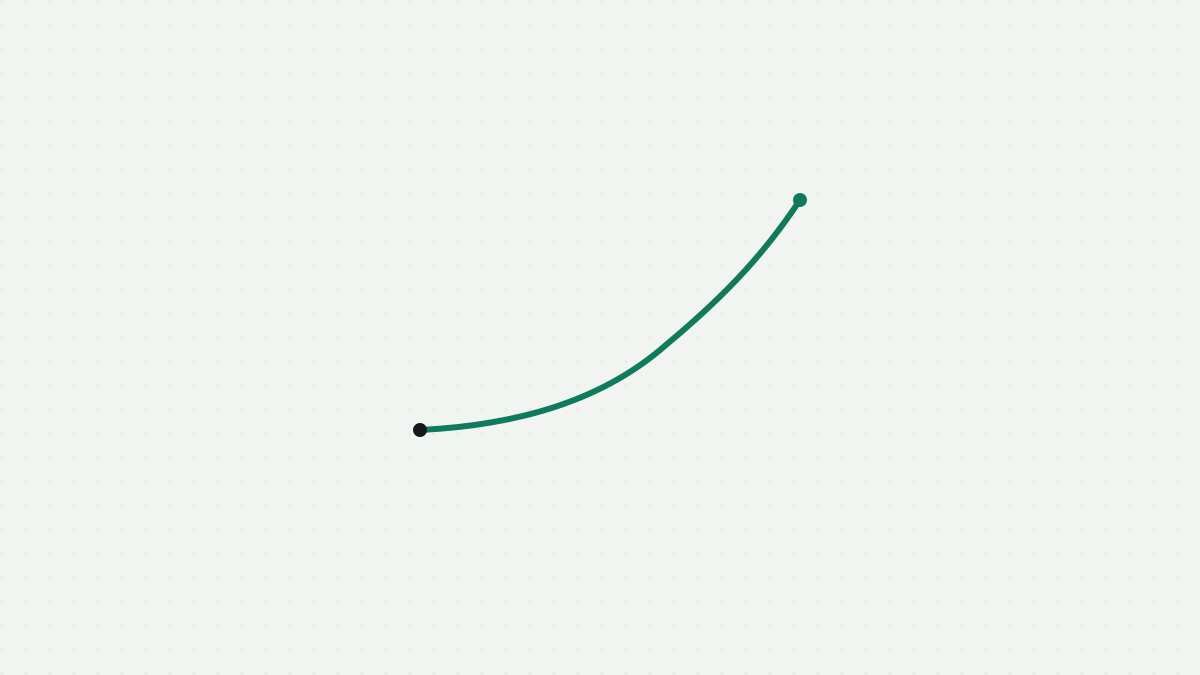
If an amount grows by a fixed percentage each year, the actual amount added each year increases over time, even though the percentage stays constant — a small addition in year one becomes a considerably larger addition in year twenty, purely because it’s now a percentage of a larger base. Most people’s intuitive mental model defaults to something closer to linear growth, imagining a roughly constant amount added each period. This is why the classic compounding illustration — a small amount doubling repeatedly — routinely produces a result that feels implausibly large to people encountering it for the first time, even though the underlying math is simple and entirely correct.
The two variables that matter more than either one alone
Compound growth depends on two things multiplying against each other: the rate of return and the time horizon over which it compounds. This multiplicative relationship means time and rate aren’t simply additive contributors to the outcome — a modest rate sustained over a long period can produce a larger eventual result than a considerably higher rate sustained over a much shorter one, purely because of how many compounding periods each one gets to work through. This is the core reason “time in the market” gets emphasised so heavily in investing education: time isn’t just one input among several, it’s doing a disproportionate share of the actual work.
Why the early years look unimpressive and the later years don’t
A particular feature of compound growth that trips people up is how unevenly the growth is distributed across time. In the early years of a compounding investment, the absolute amount added each period is small, even though the percentage return is identical to what it will be later — this is simply because the base amount hasn’t yet grown large enough for a fixed percentage to represent much in absolute terms. This produces a well-documented experience where compounding “feels” slow and unrewarding for a long stretch before it “feels” fast, even though the underlying rate never actually changed — only the base it was compounding against did.
Why fees quietly work the same way, in reverse
The same multiplicative mechanism that makes compound growth powerful also makes compounding costs — most obviously investment fees — more damaging over long horizons than their headline percentage suggests. A fee is effectively a negative rate of return compounding against the same base as the investment’s gains, meaning its true cost isn’t just the fee itself in any given year, but the growth that fee amount would otherwise have gone on to compound over every remaining year of the investment’s horizon. This is worth understanding properly rather than treating fees as a minor, fixed cost, since the actual mechanism is identical to the one that makes compound growth attractive in the first place, just working in the opposite direction.
Why this connects to diversification, not just growth rate
Compound growth assumes returns are actually realised and reinvested, which is where the practical link to diversification becomes relevant: understanding what diversification is actually protecting against matters because a severe, concentrated loss doesn’t just reduce a portfolio’s value in the year it happens — it also reduces the base that subsequent compounding has to work from, meaning a large loss early in a compounding period is considerably more costly to long-term outcomes than an equivalent-sized loss occurring later, once a larger base already exists to help absorb it.
Why past compounding illustrations shouldn’t be read as future promises
It’s worth being explicit about a limitation of compound growth illustrations: they describe a mathematical relationship, not a guarantee about what any specific investment will actually return going forward. Historical average returns used in illustrative compounding examples reflect what happened over specific past periods, and future returns for any given investment are inherently uncertain and can differ meaningfully from historical averages, including being negative over some periods. Compounding is a real mathematical mechanism; it isn’t a prediction engine.
Why this makes starting early more consequential than optimising the rate
One of the more practically important implications of the mechanism described here is that starting to invest earlier, even with a modest amount, tends to matter more to long-run outcomes than optimising for a slightly higher rate of return later. This isn’t an argument against seeking reasonable returns — it’s a reminder that time is the input working hardest inside the compounding relationship, and it’s also the one input that can never be recovered once it’s passed, unlike rate of return, which fluctuates and can improve later.
What this article is not
This is a general explanation of how compound growth works mathematically, not a projection, promise or recommendation regarding any specific investment or expected return. Actual investment returns are uncertain and can be negative; this isn’t personalised financial or investment advice.
Sources: General investing education on compound growth mechanics and long-term historical market return patterns.